
- Calculate Risk
- Predicted Risk
Terms of Service
Click the Terms tab at the bottom of the app before using the
CathPCI Bleeding Risk Calculator (“the Product”) to read the
full Terms of Service and License Agreement (the “Agreement”)
which governs the use of the Product. The Agreement includes,
among other detailed terms and conditions, certain disclaimers
of warranties by the American College of Cardiology Foundation
(“ACCF”) and requires the user to agree to release ACCF from any
and all liability arising in connection with your use of the
Product. By using the Product, you accept and agree to be bound
by all of the terms and conditions set forth in the Agreement,
including such disclaimers and releases. If you do not accept
the terms and conditions of the Agreement, you may not proceed
to use the Product. The Agreement is subject to change from time
to time, and your continued use of the Product constitutes your
acceptance of and agreement to be bound by any revised terms of
the Agreement.
For optimal use, the bleeding event risk estimate received
should be used to inform the overall conversation about the
risks/benefits of a CathPCI procedure. It should not be used to
determine the need for or against this or any medical procedure.
See the “About” screen in this app for a definition of terms and
additional instructions.
Calculate Risk
*All parameters are required to derive the adjusted CathPCI
bleeding event risk.
Patient Demographics
Patient Pre-Procedural Characteristics Reset
Predicted Risk
Adjusted CathPCI Bleeding Event Risk
Bleeding Event is an absolute drop in hemoglobin ≥ , a RBC transfusion and/or a procedural intervention/surgery to reverse/stop bleeding that occurs within 72 hours of the PCI procedure.
The model provides an objective risk-adjusted estimate of bleeding which has real value for both patient and provider. It should be considered as one element in the evaluation process, to be considered along with the other traditional factors that determine whether the patient is an appropriate candidate for the procedure.
Based on following evaluation
Patient Demographics
Patient Pre-Procedural Characteristics
| Body Mass Index (BMI) | # kg/m2 | |
| Height |
Feet
Inches
cms
|
|
| Weight | lbs kgs | |
| Baseline Hemoglobin | g/dL g/L | |
| Prior STEMI | Yes No | |
| Prior Cardiogenic Shock | Yes No | |
| Prior PCI | Yes No | |
| Dialysis | Yes No | |
| Glomerular Filtration Rate (estimated) | N/A mL/min/1.73m2 | |
| Serum Creatinine (SCr) | mg/dL µmol/L | |
Resources
JACC Article An Updated Bleeding Model to Predict the Risk of Post-Procedure Bleeding Among Patients Undergoing Percutaneous Coronary Intervention A Report Using an Expanded Bleeding Definition From the National Cardiovascular Data Registry CathPCI Registry
An Updated Bleeding Model to Predict the Risk of Post-Procedure Bleeding Among Patients Undergoing Percutaneous Coronary Intervention: Sunil V. Rao, Lisa A. McCoy, John A. Spertus, Ronald J. Krone, Mandeep Singh, Susan Fitzgerald, and Eric D. Peterson. An Updated Bleeding Model to Predict the Risk of Post-Procedure Bleeding Among Patients Undergoing Percutaneous Coronary Intervention: A Report Using an Expanded Bleeding Definition From the National Cardiovascular Data Registry CathPCI Registry. J Am Coll Cardiol Intv. 2013 Sep, 6 (9) 897–904
To access the tools from this checklist, visit CVQuality.ACC.org and log in or register by creating or using an ACC username and password.
Clinical Toolkit
PCI Bleeding Risk Checklist
Use to identify common problems and possible
solutions to reduce the risk of bleeding
complications.
Procedure Performance Issue
COMMON PROBLEM: Improper Performance of Procedure
Tools
- Risk Factors that Increase Vascular Complications After PCI
- Indications For PCI in STEMI
- Pre-PCI Procedure Orders
- Arterial Access Protocol for PCI
Protocol Issues
COMMON PROBLEM: Lack of Protocol to Prevent Postoperative Bleeding
Tools
- Post-PCI Procedural Recommendations After PCI
- Post-PCI Procedure Groin Bleed
- Post-PCI Procedure Orders
- Post-PCI Sheath Removal Protocol
- Post-PCI Sheath Removal Checklist
- Competency Assessment for Arterial and Venous Sheath Removal
COMMON PROBLEM: Lack of Knowledge About Patient Factors That Can Contribute to Risk of Postoperative Bleeding
Tools
- Risk Factors that Increase Vascular Complications After PCI
COMMON PROBLEM: Failure to Identify Early Warning Signs of Postoperative Bleeding
Tools
- Early Warning Signs of A Vascular Complication After PCI
Medication Management Issues
COMMON PROBLEM: Improper Improper Preoperative, Intraoperative, and Postoperative Medication Management
Tools
- Risk Factors That Increase Vascular Complications After PCI
- General Considerations For Use of Anti-Platelets and Anti-Coagulants During PCI
- Recommendations For Anticoagulant Therapy During PCI
- Surviving MI for Broad Engagement of Pharmacists for AMI Care
Communication Issues
COMMON PROBLEM: Lack of Communication Among Clinicians
Tools
- Surviving MI Barriers and Solutions to Forming a Physician and Nurse Champion Team
- Surviving MI Characteristics of Clinical Champions (Physician and Nurse)
COMMON PROBLEM: Failure to Communicate Early That Patient Is at Risk For Postoperative Bleeding Once Clinical Signs Are Recognized
Tools
- SBAR Report to a Physician
The Full Model
| Category | OR |
95% CI |
Chi- Square |
|---|---|---|---|
| Demographic characteristics and medical history | |||
| Female vs. male | 1.97 | 1.93– 2.02 |
4,045.30 |
| Dialysis vs. no disease | 1.88 | 1.80– 1.95 |
975.02 |
| Moderate chronic kidney disease (GFR = 30–44 ml/min) vs. no disease | 1.68 | 1.62– 1.73 |
918.89 |
| Previous PCI | 0.74 | 0.72– 0.76 |
726.13 |
| BMI (when BMI ≤ 30 kg/m2)∗ | 0.96 | 0.96– 0.97 |
594.60 |
| Mild chronic kidney disease (GFR = 45–59 ml/min) vs. no disease | 1.34 | 1.31– 1.38 |
487.83 |
| Heart Failure NYHA class IV within 2 weeks Heart failure NYHA class IV within 2 weeks vs. no heart failure within 2 weeks | 1.63 | 1.56– 1.70 |
458.03 |
| Age (≤70 yrs)∗ | 1.02 | 1.01– 1.02 |
456.10 |
| Chronic lung disease | 1.23 | 1.19– 1.26 |
241.87 |
| Peripheral vascular disease | 1.19 | 1.15– 1.22 |
139.27 |
| NYHA functional class IV HF within 2 weeks before PCI vs. NYHA functional class<IV | 1.17 | 1.13– 1.21 |
76.74 |
| Cerebrovascular disease | 1.13 | 1.10– 1.16 |
74.81 |
| Age (>70 yrs)∗ | 1.01 | 1.00– 1.01 |
51.20 |
| Insulin requiring diabetes mellitus vs. no diabetes | 1.09 | 1.06– 1.13 |
32.29 |
| Presenting characteristics and PCI status | |||
| Shock within 24 h before and at start of PCI or Salvage procedure | 6.02 | 5.67– 6.39 |
3,511.54 |
| Emergent procedure | 2.88 | 2.76– 3.00 |
2,557.14 |
| Shock within 24 h or at start of PCI | 4.39 | 4.13– 4.66 |
2,334.84 |
| Urgent procedure | 1.50 | 1.46– 1.54 |
948.41 |
| Shock within 24 h and at start of PCI | 5.22 | 4.56– 5.98 |
571.96 |
| Cardiac arrest within 24 h of PCI | 1.75 | 1.66– 1.83 |
533.55 |
| Lytics before PCI for STEMI | 1.12 | 1.04– 1.19 |
10.11 |
| Laboratory values | |||
| Pre-PCI Hb (Hb ≤13 g/dl)∗ | 0.80 | 0.79– 0.81 |
2,300.92 |
| Pre-PCI Hb (Hb >13 g/dl)∗ | 1.11 | 1.10– 1.12 |
621.50 |
| Procedural characteristics | |||
| 2- or 3-vessel disease vs. no disease or 1-vessel disease | 1.23 | 1.20– 1.25 |
397.13 |
| STEMI | 1.45 | 1.40– 1.50 |
376.49 |
| SCAI lesion class II or III | 1.25 | 1.22– 1.28 |
330.45 |
| SCAI lesion class IV | 1.43 | 1.37– 1.49 |
301.23 |
| Pre-procedure TIMI flow grade = 0 | 1.24 | 1.20– 1.29 |
151.28 |
| Left main PCI | 1.43 | 1.35– 1.51 |
149.45 |
| Subacute stent thrombosis | 1.61 | 1.44– 1.81 |
67.12 |
| Proximal LAD PCI | 1.10 | 1.07– 1.12 |
51.43 |
- ∗ Variables transformed using splines
NCDR CathPCI Bleeding Risk Score
| Variable | Score | |||
|---|---|---|---|---|
| STEMI | No | Yes | ||
| 0 | 15 | |||
| Age, yrs | <60 | 60–70 | 71–79 | ≥80 |
| 0 | 10 | 15 | 20 | |
| BMI | <20 | 20–30 | 31–39 | ≥40 |
| 15 | 5 | 0 | 5 | |
| Previous PCI | No | Yes | ||
| 10 | 0 | |||
| Chronic kidney disease | No | Mild | Moderate | Dialysis |
| 0 | 10 | 25 | 30 | |
| Shock | No | Yes | ||
| 0 | 35 | |||
| Cardiac arrest within 24 h | No | Yes | ||
| 0 | 15 | |||
| Female | No | Yes | ||
| 0 | 20 | |||
| Hb | Hb <13 | 13 ≤Hb <15 | Hb ≥15 | |
| 5 | 0 | 10 | ||
| PCI status | Elective | Urgent | Emergency/salvage | |
| 0 | 20 | 40 | ||
BMI = body mass index; CABG = coronary artery bypass grafting; Hb = hemoglobin; PCI = percutaneous coronary intervention; STEMI = ST-segment elevation myocardial infarction.
Risk of Bleeding Based on Point Totals From the NCDR CathPCI Registry Bleeding Risk Score
| Total Points | Risk of Bleeding, % |
|---|---|
| 0 | 0.90 |
| 5 | 1.10 |
| 10 | 1.30 |
| 15 | 1.50 |
| 20 | 1.70 |
| 25 | 2.00 |
| 30 | 2.30 |
| 35 | 2.70 |
| 40 | 3.10 |
| 45 | 3.60 |
| 50 | 4.20 |
| 55 | 4.90 |
| 60 | 5.60 |
| 65 | 6.50 |
| 70 | 7.50 |
| 75 | 8.60 |
| 80 | 9.90 |
| 85 | 11.40 |
| 90 | 13.10 |
| 95 | 14.90 |
| 100 | 17.00 |
| 105 | 19.30 |
| 110 | 21.80 |
| 115 | 24.60 |
| 120 | 27.50 |
| 125 | 30.70 |
| 130 | 34.10 |
| 135 | 37.60 |
| 140 | 41.30 |
| 145 | 45.10 |
| 150 | 49.00 |
| 155 | 52.80 |
| 160 | 56.60 |
| 165 | 60.40 |
| 170 | 64.00 |
| 175 | 67.50 |
| 180 | 70.80 |
| 185 | 73.90 |
| 190 | 76.80 |
| 195 | 79.40 |
| 200 | 81.80 |
| 205 | 84.00 |
| 210 | 86.00 |
Risk of Post-Percutaneous Coronary Intervention Bleeding Based on the Bedside Bleeding Risk Prediction Score
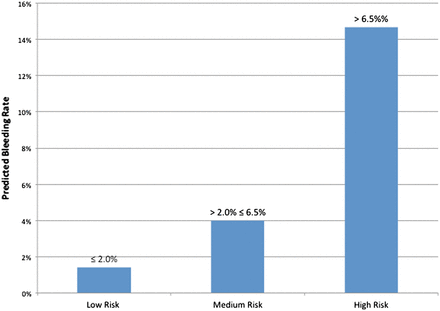
The predicted risk of in-hospital bleeding among patients determined to be at low, medium, or high risk of bleeding based on the bedside bleeding risk score. Scores of ≤25 are low risk, scores 25 to 65 are medium risk, and scores >65 are high risk.
Terms
CathPCI Bleeding Risk Calculator Terms of Service and License Agreement
This Terms of Service and License Agreement constitutes a legal agreement (collectively, the "Agreement") between the American College of Cardiology Foundation ("ACCF") and You and your agents ("You") for the use of the CathPCI Bleeding Risk Calculator (the "Product"), whether You use the mobile application version of the Product or the web version of the Product. The Product allows You to access certain content included in the Product ("Content") relating to calculation of experiencing a bleed event post percutaneous coronary intervention procedure.
By using the Product, You accept and agree to be bound by all of the terms and conditions set forth in this Agreement. If You do not wish to accept the terms and conditions of this Agreement, You may not proceed to use the Product.
ACCF may change the terms of this Agreement from time to time without further notice directly to You. When the terms are changed, ACCF will post a general conspicuous notice. If You do not agree with the revised terms, please discontinue use of the Product immediately. Your continued use of the Product following such notice constitutes your acceptance of and agreement to be bound by any revised terms of the Agreement. This Agreement expressly incorporates by reference and includes rules or disclaimers that may be posted and updated within the Product or communicated to You from time to time.
Term and Termination
ACCF may terminate your access and/or the Product at any time. You agree that any termination of your access to the Product shall not result in any liability or other obligation of ACCF to You, or any third party in connection with such termination.
Intellectual Property Rights
This Product, including the information, text, graphics, images, audio and video files, trademarks and other materials that may be contained therein (collectively "Content"), is owned by ACCF and/or its suppliers and is protected by patents, copyrights, trademarks, and other proprietary rights. Except as specifically provided in this Agreement, your use of the Product shall be governed and constrained by applicable patent, copyright, trademark and other intellectual property laws. ACCF grants You a limited, nonexclusive, nontransferable, revocable license to utilize and access the Product for your noncommercial, personal use according to the terms and conditions in this Agreement. You may not modify, publish, transmit, participate in the transfer or sale of, reproduce, create derivative works from, distribute, perform, display, incorporate into another website, or in any other way exploit the Service and/or any of the Content, in whole or in part. Except as expressly granted by this Agreement, You acquire no right, title or interest in the Product or the Content or other data or materials incorporated in the Product. ACCF, ACC or affiliates or licensors thereof shall retain all right, title and interest in the Product and Content.
Limitation of Liability
TO THE FULLEST EXTENT ALLOWED BY APPLICABLE LAW, ACCF HEREBY DISCLAIMS, AND IN NO EVENT SHALL ACCF OR ANY PARTY INVOLVED IN CREATING OR PRODUCING THE PRODUCT BE LIABLE FOR, ANY DIRECT, INDIRECT, INCIDENTAL, SPECIAL, CONSEQUENTIAL, OR EXEMPLARY DAMAGES, INCLUDING WITHOUT LIMITATION, DAMAGES FOR LOSS OF PROFITS, GOODWILL, USE, DATA LOSS, OR OTHER LOSSES, WHETHER IN AN ACTION OF CONTRACT, NEGLIGENCE OR OTHER TORTIOUS ACTION, EVEN IF ACCF HAS BEEN ADVISED OF THE POSSIBILITY OF SUCH DAMAGES, RESULTING FROM: (i) THE USE OR INABILITY TO USE THE PRODUCT, (ii) THE COST OF ANY SUBSTITUTE PRODUCTS AND/OR SERVICES RESULTING FROM ANY PRODUCTS, DATA, INFORMATION OR SERVICES OBTAINED OR WHICH YOU WERE UNABLE TO OBTAIN OR TRANSACTIONS EFFECTED OR FAILED TO BE EFFECTED, (iii) THE USE OR INABILITY TO USE ANY THIRD PARTY APPLICATIONS CONTAINED WITHIN THE PRODUCT, OR (iv) ANY MATTER OTHERWISE RELATED TO YOUR USE OF THE PRODUCT.
Release of Liability
You assume all risks associated with use of the Product including, but not limited to any harm, injury or damages resulting directly or indirectly from the use of the Product, all such risks being known and understood by You. In consideration of your use of the Product, You, for yourself and anyone entitled to act on your behalf, waive and forever release ACCF, its officers, trustees, employees, representatives and successors from all claims and liabilities of any kind arising out of your use or misuse of the Product.
Indemnification
You hereby agree to indemnify, save and hold ACCF, its directors, officers, shareholders, parents, subsidiaries, affiliates, agents and licensors harmless from and against any and all claims, liability, losses, damages and costs, including, without limitation, reasonable attorneys' fees and costs, arising out of your use or misuse of the Product or Content, or any violation of this Agreement. ACCF assumes the right, at your expense, to assume the exclusive defense and control of any matter for which you are required to indemnify ACCF, and you agree to cooperate with ACCF’s defense of these claims. ACCF will use reasonable efforts to notify you of any such claim, action, or proceeding upon becoming aware of it.
Disclaimer of Warranties
THE PRODUCT AND CONTENT ARE PROVIDED ON AN "AS IS" AND "AS AVAILABLE" BASIS. ACCF AND ITS SUPPLIERS EXPRESSLY DISCLAIM ALL WARRANTIES OF ANY KIND WITH RESPECT TO THE PRODUCT OR CONTENT, WHETHER EXPRESS OR IMPLIED, INCLUDING IMPLIED WARRANTIES OF MERCHANTABILITY, FITNESS FOR A PARTICULAR PURPOSE, TITLE AND NON-INFRINGEMENT. ACCF MAKES NO WARRANTY THAT THE PRODUCT AND/OR ANY CONTENT THEREIN WILL MEET YOUR REQUIREMENTS, OR WILL BE UNINTERRUPTED, TIMELY, SECURE, CURRENT, ACCURATE, COMPLETE OR ERROR-FREE OR THE RESULTS THAT MAY BE OBTAINED BY USE OF THE PRODUCT OR ANY CONTENT THEREIN WILL BE ACCURATE OR RELIABLE. YOU UNDERSTAND AND ACKNOWLEDGE THAT YOUR SOLE AND EXCLUSIVE REMEDY WITH RESPECT TO ANY DEFECT IN OR DISSATISFACTION WITH THE PRODUCT IS TO CEASE ITS USE.
The Content on the Product is presented as an educational service intended for licensed healthcare professionals. While the Content in the Product is about specific medical and healthcare issues, the Content is not a substitute for or replacement of personalized medical advice and is not intended to be used as the sole basis for making individualized medical or health-related decisions.
The views and opinions expressed are those of the contributing authors and editors and do not necessarily represent the views of the ACCF. The material is not intended to present the only, or necessarily best, methods or procedures for the medical situations addressed, but rather is intended to represent an approach, view, statement or opinion.
Any reference to a specific therapy or commercial product in this Product does not constitute a guarantee or endorsement by ACCF of the quality or value of such therapy or product or any claims made by the manufacturer of such therapy or commercial product. In addition, any statements about such therapy or commercial products are solely based on published clinical prediction rules and estimates of drug treatment effects from published clinical studies and do not represent an ACCF endorsement or evaluation of these products.
Force Majeure
ACCF will be excused from performance under this Agreement and will not be liable or considered in default under this Agreement in the event that the Product is unavailable for any period of time, or if ACCF is otherwise unable to perform its obligations hereunder, in whole or in part, as a result of a Force Majeure Event. For purposes of this Section, "Force Majeure Event" means an event or series of events caused by or resulting from any of the following: (1) weather conditions or other elements of nature or acts of God; (2) government regulation; (3) quarantines or embargoes; (4) telecommunications, network, computer, server or Internet downtime; (5) unauthorized access to ACCF's information technology systems by third parties; or (6) any other causes beyond the reasonable control of ACCF.
No Assignment
This Agreement is personal to You, and You may not assign your rights or obligations to anyone.
No Waiver
Neither failure nor delay on the part of any party to exercise any right, remedy, power or privilege hereunder nor course of dealing between the parties shall operate as a waiver thereof, or of the exercise of any other right, remedy, power or privilege. No term of this Agreement shall be deemed waived, and no breach consented to, unless such waiver or consent shall be in writing and signed by the party claimed to have waived or consented. No waiver of any rights or consent to any breaches shall constitute a waiver of any other rights or consent to any other breach.
Severability
If any provision in this Agreement is held invalid or unenforceable under applicable law, the remaining provisions shall continue in full force and effect.
Governing Law
This Agreement will be governed by and construed exclusively in accordance with the laws of the District of Columbia, USA, without regard to its conflicts of law principles and, to the extent applicable, the federal laws of the United States. If a dispute arises between ACCF and You, You hereby agree to submit such dispute to non-binding mediation, followed by binding arbitration, if necessary. Both the mediation and arbitration will be conducted by JAMS applying the laws of the District of Columbia without regard to its conflicts of laws principles and in the District of Columbia as venue.
Certification
I hereby certify that I understand and agree to the terms stated in this Agreement and that this Agreement applies to my initial use of the Product and all other subsequent uses of the Product. BY USING THIS PRODUCT, I HEREBY AFFIRM THAT I HAVE READ, FULLY UNDERSTAND, AND AGREE TO THE ABOVE STATEMENTS.
About the App
When was this app last updated?
May 2023
How can I provide feedback?
How is this app intended to be used?
This App is intended to help clinicians treating patients post-PCI. It is intended to be used by clinicians evaluating patients who are undergoing a PCI procedure for their risk of experiencing a bleeding event post procedure and to support clinical decisions regarding PCI procedures on an individual basis, integrating clinical judgment, assessment of the bleeding risk involved, and patient preference.
How was this app developed?
The App was developed by the ACC to transform cardiovascular care and improve heart health through the implementation of clinical policy at the point of care. It was developed with the review and guidance of a Work Group of ACC representatives and experts in the field, and with the oversight of the ACC Science and Quality Committee. Development of the App included several rounds of user testing within the ACC and representatives of the target audience.
For Support
Call: (202) 375-6000, ext. 5603
Or (800) 253-4636
Fax: (202) 375-7000
Email:
resource@acc.org
Health Outcomes Sciences
If you would like to receive information about other products associated with the CathPCI Bleeding Risk Model click here.
News
Locked
The system has been locked
This version of the application has been
locked because of need to ugrade the science.
Please go to the store upgrade this application.
Go to store